India Is More Than the World’s Dumping Ground

Ship graveyards and e-waste hubs complicate the dumping-ground label
A ship can spend thirty years carrying goods between ports before making its final voyage towards a beach. At Alang on the Gulf of Cambay, vessels are driven onto tidal mudflats and cut apart. Elsewhere in India, circuit boards are broken down for the metals inside them. The objects differ in scale. Their disposal raises a shared question about the people left to carry the cost after their useful life ends.
Calling India the world’s dumping ground gives that question an easy answer. The evidence needs a more specific account of foreign waste flows and the much larger waste burden generated at home.
The Waste India Generates at Home
The Central Pollution Control Board recorded about 170,339 tonnes of municipal solid waste generated each day in 2021–22. Around 91,511 tonnes were reported as processed or treated, equivalent to 54 percent. About 41,455 tonnes went to sanitary landfills. The remaining gap was roughly 37,373 tonnes a day, or 22 percent of the total. The report also recorded 2,452 active dumpsites [1].

These figures concern domestic waste. They do not establish that foreign material fills India’s landfills. An argument about waste colonialism therefore needs evidence of cross-border movement and unequal arrangements that shift disposal costs. Domestic waste generation and imported waste can coexist without having the same origin or responsible parties.
The Ships That Arrive to Die
Alang–Sosiya handles about 98 percent of India’s ship recycling. Its yards extend along roughly 10 kilometres of coast. Official figures give a capacity of about 4.5 million tonnes a year across 153 plots [2].
Beaching brings vessels onto tidal mudflats for dismantling near the shore. It reduces costs while making hazardous substances harder to contain. Ships may carry asbestos and oil residues alongside PCBs, lead-based paints and other heavy metals [2]. Recovering valuable steel leaves the yard with materials that need safe handling and disposal.

A peer-reviewed study traced the movement of shipbreaking from more regulated regions towards Bangladesh, India and Pakistan. The study examined earlier shipbreaking centres in the European Union, Japan, Taiwan and Russia. It estimated that hazardous-waste emissions from shipbreaking in the three South Asian countries rose about 6.5 times between 1990 and 2019 [3].
The study also modelled changes under stricter standards. Emissions were estimated to fall by 79 percent under a Hong Kong Convention scenario and 92 percent under an EU scenario [3]. These figures describe modelled possibilities rather than reductions already measured at shipyards.
Rules at the Shore

The Ship Recycling Act of 2019 established provisions for authorisation, inspection and hazardous-material management. India’s shipping regulator records that the Hong Kong Convention entered into force on 26 June 2025 [4]. Independent monitors continue to question conditions at the yards. Their concerns extend from beaching and hazardous-waste disposal to worker housing, medical facilities and access to reliable information.
The independent monitoring organisation cited in [5] reports about 15,000 workers at Alang–Sosiya. Citing Toxics Watch Alliance research, it also reports at least 434 deaths in Indian yards between 1991 and 2012 [5]. These are historical figures from the cited research rather than a complete official count. They cannot establish current accident rates. They do make worker safety central to any account of the industry’s costs.
The Plastic That Came After China
China’s closure of its plastic-waste market redirected material towards other destinations. India imported about 294 million pounds of plastic scrap from the United States in 2018. The corresponding figures were 203 million pounds in 2016 and 271 million pounds in 2017 [6].
India had banned plastic-scrap imports in 2016 while retaining exceptions for some Special Economic Zones and Export-Oriented Units. In 2019, it moved to close those exceptions [6]. The policy response matters. India restricted the diverted flow instead of accepting an indefinite role as its destination.

Meanwhile, reported domestic plastic-waste generation rose from 1.57 million tonnes in 2016–17 to 4.13 million tonnes in 2020–21 [7]. Imported scrap arrived alongside an expanding burden generated within the country.
Recovering Metals in Moradabad
Moradabad in Uttar Pradesh is a major centre of informal e-waste recycling. Dismantling and metal recovery take place in homes, basements and small workshops. Some activity extends to sites along the Ramganga river. Methods described in the Centre for Science and Environment report include hammering circuit boards and heating components. Open burning and acid baths are also used to recover valuable metals [8].
CSE found high concentrations of several metals in soil near the river. These included copper and zinc alongside lead, chromium, nickel and arsenic. One sample contained about 73,600 ppm of zinc [8].
Even the size of the workforce was uncertain. Municipal estimates put it at 20,000–25,000 people. District administration estimates ranged from 100,000 to 150,000 [8]. The difference makes the limits of official records difficult to ignore. The lack of a dependable count makes it harder to document exposure and reach workers with protections.
The Evidence on Foreign E-Waste
The Moradabad report describes components arriving through domestic supply chains from Delhi and other major Indian cities [8]. It does not establish that most of the material originated in wealthy countries. The case documents unsafe informal recycling and unequal exposure within India. A claim about foreign dumping needs additional evidence of the material’s origin.

India prohibits hazardous e-waste imports. Misdeclared shipments of used electronics or scrap may still enter, although their volume is difficult to establish. That uncertainty should remain visible rather than becoming a claim about the source of all waste processed in Moradabad.
Domestic generation is substantial. India’s estimated e-waste rose from 708,445 tonnes in 2017–18 to 1,601,155 tonnes in 2021–22. In the latter year, 32.92 percent was reported as collected, dismantled, recycled or disposed of [9]. The E-Waste Management Rules, 2022 took effect on 1 April 2023 and expanded provisions for Extended Producer Responsibility. The stated objective included moving informal recycling into formal systems [9].
The Mountain at Home
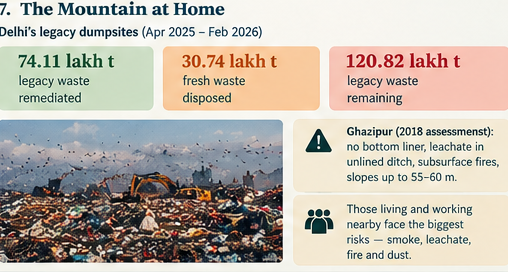
Disposal costs can shift between communities without crossing a national border. Delhi’s Economic Survey 2025–26 reports 74.11 lakh tonnes of legacy waste remediated at Ghazipur, Bhalswa and Okhla between April 2025 and February 2026. During the same period, 30.74 lakh tonnes of fresh waste were disposed of at those sites. The reported legacy stock remaining was 120.82 lakh tonnes [10].
A 2018 technical assessment described Ghazipur as an open dumpsite. It recorded the absence of a bottom liner and leachate draining into an unlined ditch. It also described subsurface fires and sections reaching heights of 55 to 60 metres [11]. These observations belong to the assessment’s date and cannot substitute for current inspection.
The wider city generates the waste. Those living and working beside the site face its most immediate smoke and fire risks. They may also encounter leachate. Proximity gives them a share of the burden far larger than their share of consumption.
Following the Cost
India generates large amounts of domestic waste while receiving vessels for dismantling and some foreign scrap. Its informal recycling economy recovers valuable materials under conditions that can expose workers and nearby communities to harm. These roles need separate explanations even where they overlap.
Revenue travels differently from residues. Steel and recovered metals can enter new markets while injuries and contamination remain near the disposal site. Where unequal cross-border arrangements transfer those burdens to communities with less power to refuse them, waste colonialism helps explain the relationship. Similar transfers within India raise questions of internal environmental injustice.
The dumping-ground label compresses these differences into a single image. Following the material gives a fuller account. Who earned from it before disposal, who earns from recovering it, and who is left with the part nobody wants?
Sources
[1] Central Pollution Control Board, Annual Report on Solid Waste Management, 2021–22.
[2] Ministry of Ports, Shipping and Waterways, Shipping Division.
[3] Lin and colleagues, study on global shipbreaking and hazardous-waste emissions, Global Environmental Change, 2022.
[4] Directorate General of Shipping, Ship Recycling in India.
[5] NGO Shipbreaking Platform, The problem in India.
[6] Resource Recycling, India to end plastic scrap imports, March 2019.
[7] Government of India, Press Information Bureau, plastic-waste generation data.
[8] Centre for Science and Environment, informal e-waste sector report, via the Basel Convention.
[9] Government of India, Press Information Bureau, e-waste generation and rules.
[10] Government of Delhi, Economic Survey of Delhi 2025–26.
[11] SCS Engineers, Ghazipur Landfill Rehabilitation Report, 2018.


Comments